
E003 · MOON+SUN TIDES VS EARTHQUAKES BY MAGNITUDE AND DEPTHa tidal triggering earthquake test by magnitude and depth · a published null result
Across magnitude and depth groups of the declustered M5.5+ catalog, do earthquakes cluster at new/full Moon, at perigee, or on the highest-tide days, compared with random times?
- NULL
- Result
- 16,576
- Earthquakes tested
- 1.82
- Largest |z|
- 1
- Smallest corrected p
- 63
- Tests (Bonferroni family)
- 7
- Cells shown
- 2
- Files fingerprinted
What was compared?
The earthquakes come straight from the agency that publishes them; the sky positions are computed and checked against the agency reference. Nothing is pre-filtered, nothing is hand-picked; every input is cached and fingerprinted (see 06).
| Role | Series | Primary source | Range · catalogs |
|---|---|---|---|
| Factor | Moon & Sun tidal amplitude · Meeus ch. 47 + JPL elements, checked against JPL Horizons DE441 | https://ssd.jpl.nasa.gov/horizons/ | 1970 → 2025 |
| Target | USGS ComCat | https://earthquake.usgs.gov/fdsnws/event/1/ | A: M5.5+ 1970–2025 → 16576 mainshocks (Gardner–Knopoff) |
How was the test run?
USGS ComCat M5.5+ 1970–2025 with real UTC event times, declustered with Gardner–Knopoff 1974 windows to 16576 mainshocks, split into 7 groups (all, M6+, M7+, shallow ≤70 km, deep >70 km as the control, shallow M6+, shallow M7+). For each event: Moon phase, distance, latitude and the Moon+Sun tidal amplitude; tidal deciles come from a daily grid over the whole span. 9 metrics per group (63 tests) against a Monte Carlo null of 2000 randomized-time sets — A uniform over 1970–2025, C same year at a random time — seed 369. The least extreme null is kept; p (normal approximation from z) is Bonferroni-corrected over 63. EFFECT needs corrected p < 0.05.
Every cell, nothing left out
z says how far the value at earthquake times sits from the random-time values, in random-time standard deviations; values under 2 are ordinary scatter. Corrected p is two-sided and already multiplied by the 63 tests; EFFECT needs it below 0.05.
| Group | Most extreme metric | n | Observed (quake times) | Random-time mean | z | corrected p | Result |
|---|---|---|---|---|---|---|---|
| All M5.5+ | share in bottom tidal decile | 16576 | 0.1031 | 0.09979 | +1.38 | 1 | NULL |
| M6+ | top ÷ bottom tidal decile | 5702 | 0.912 | 1.0051 | -1.55 | 1 | NULL |
| M7+ | phase bunching | 704 | 0.0587 | 0.03353 | +1.44 | 1 | NULL |
| Shallow ≤70 km | share at perigee < 370,000 km | 12839 | 0.2259 | 0.2205 | +1.45 | 1 | NULL |
| Deep >70 km (control) | new-or-full bunching | 3737 | 0.02895 | 0.01669 | +1.41 | 1 | NULL |
| Shallow M6+ | top ÷ bottom tidal decile | 4408 | 0.9031 | 1.0057 | -1.51 | 1 | NULL |
| Shallow M7+ | share in bottom tidal decile | 530 | 0.07547 | 0.0992 | -1.82 | 1 | NULL |
Every test, drawn
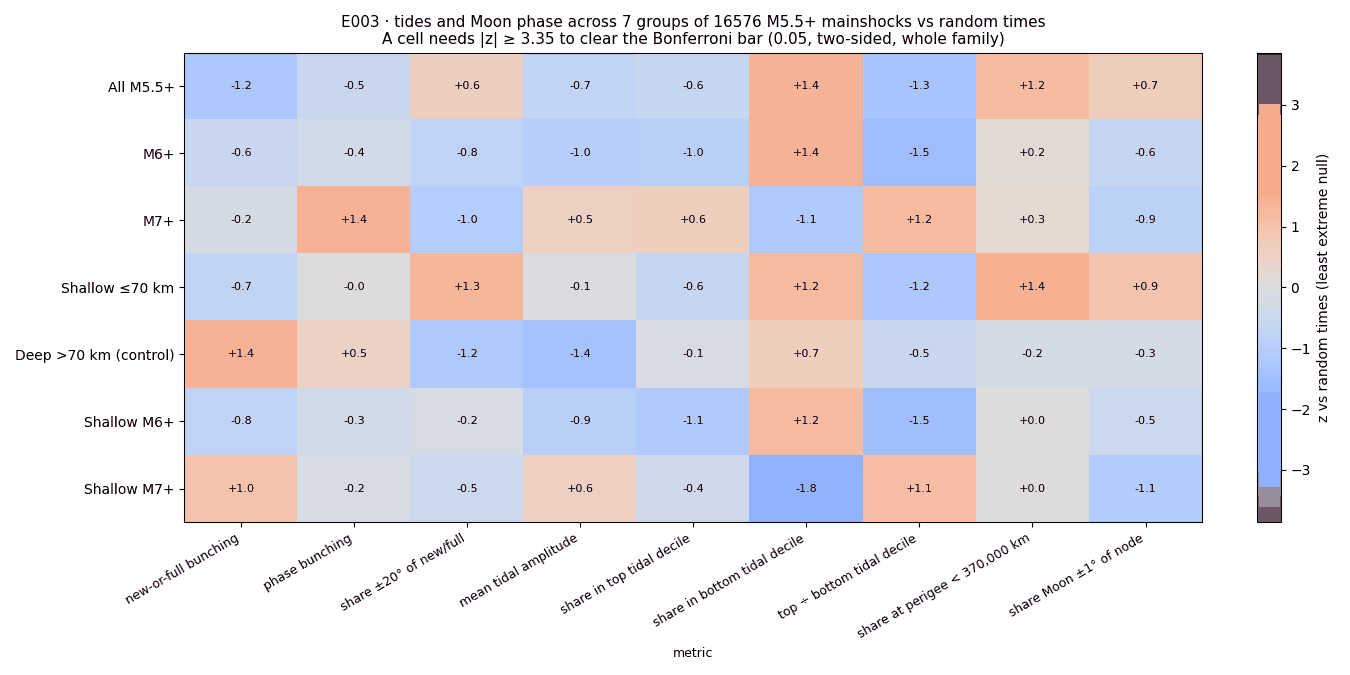
Amplitude only: the tide is not resolved onto each fault plane, which is where Ide et al. 2016 report a few-percent rate change for the largest events. Read the trend across groups, not one cell; deep events are the control. Earlier research run 2026-09-04 (same catalog, seed 20260904) found no cell surviving correction.
Who asked this before us?
An evaluation is not a discovery. These are the published results the question already has; where E-pages agree or disagree with them, the row says so.
- Ide, S., Yabe, S. & Tanaka, Y. (2016). Earthquake potential revealed by tidal influence on earthquake size–frequency statistics. Nature Geoscience 9, 834–837. doi:10.1038/ngeo2796 — Resolves the tide onto each fault and reports a modest rise in the share of large events at high tidal stress. This evaluation tests tidal amplitude only and sees no measurable effect; it does not test their fault-resolved measure, so it neither confirms nor contradicts it.
- Gardner, J. K. & Knopoff, L. (1974). Is the sequence of earthquakes in Southern California, with aftershocks removed, Poissonian? Bull. Seismol. Soc. Am. 64, 1363–1367. — Declustering windows used here.
Reproduce every number above
The script reads the cached USGS catalog and JPL Horizons reference shipped in the zip, declusters, draws the nulls and writes E003_result.json. Change --draws or --seed and see whether anything moves.
python3 tq_eval_003_tides_groups.py --seed 369 --draws 2000
| Item | Value |
|---|---|
| Script | tq_eval_003_tides_groups.py |
| Script SHA-256 | 68bc877e25942dba2be97027969dc76895986f83c368110a7be8cf4ff192275e |
| Run on | NIK · 2026-10-27 · seed 369 |
| Source copy | E003_reproduce.zip — the script, its helper, both cached inputs, in one download. |
SHA-256 of every cached input
USGS ComCat M5.5+ 1970–2025 downloaded 2026-09-04 and cached unchanged; JPL Horizons reference positions cached on the first run. Re-runs read the cache, so the numbers do not drift when the agencies revise their catalogs.
| File | SHA-256 |
|---|---|
| usgs_m55_1970_2025.csv | eb0b76b9c7b7bcf9cad71b8a18652509df1247428ab2f7ca1a07d1b9a81ad16c |
| horizons_check.json | cc748711826b8bfbfcb80c8af3897b9543f3038f635c6afa8cf1f6848e03af02 |
Hashed and time-stamped
Every file behind this page — the result, the verdict, the chart, the script, its helpers and every cached input — is listed with its SHA-256 in the manifest. The manifest itself was submitted to OpenTimestamps on 2026-10-27; the proof is anchored in the Bitcoin blockchain, so anyone can show these numbers existed, unchanged, on that date.
| Item | Value |
|---|---|
| Manifest | E003_MANIFEST.sha256 · 9 files |
| Manifest SHA-256 | 50384fcb0f495695785486cfe80b99d087c68fe2c5b345720ef70346caeabe70 |
| Time-stamp | E003_MANIFEST.sha256.ots · OpenTimestamps · 2026-10-27 |
| Verify | sha256sum -c E003_MANIFEST.sha256 then ots verify E003_MANIFEST.sha256.ots |
What do people ask about E003?
What did E003 test?
Across magnitude and depth groups of the declustered M5.5+ catalog, do earthquakes cluster at new/full Moon, at perigee, or on the highest-tide days, compared with random times?
What was the result?
NULL. Across 7 cells (63 tests) the most extreme value sat 1.82 standard deviations from the random-time values; after correcting for the number of tests the smallest p was 1, so nothing passes.
Where does the data come from?
USGS ComCat for the earthquakes; Moon and Sun positions computed with Meeus and JPL elements and checked against JPL Horizons on 40 dates. Every input is cached and fingerprinted with SHA-256.