Schumann Resonance Monitor: Live 7.83 Hz Ionospheric Resonances
Live from the Tomsk SOS70 observatory: Earth's 7.83 Hz Schumann resonance and its harmonics, with NOAA geomagnetic data.
Every panel is observed measurement or published model output from research stations and NOAA. Nothing here computes or implies any correlation, and nothing predicts.
WHAT IS TOMSK SOS70 RECORDING? — PRIMARY SCHUMANN DATA
Siberian observatory · mirrored, refreshed every 5 min〰 Schumann Decoder · mini
NIKOLA TESLA WEB LAB📊 Main Spectrogram
LIVE · SOS70📈 Frequencies
SOS70📉 Amplitudes
SOS70🇮🇹 Cumiana Live
SOS70WHAT IS THE IONOSPHERE DOING? — TEC & ABSORPTION
Ionospheric & geomagnetic context🇮🇹 Cumiana 5-Day Strips
VLF.IT🌐 World Ionospheric Map
BOM SWS🌍 Global TEC Map
NEW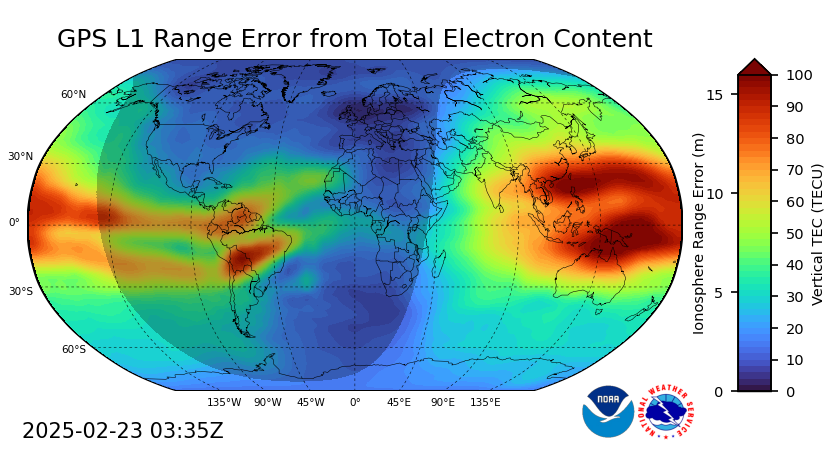
WHERE ARE THE STATIONS? — 6 CONTINENTS
Compare regional variations for local vs global eventsWhat did Nikola Tesla's 1905 patent say about waves in the earth?
“In the course of certain investigations which I carried on for the purpose of studying the effects of lightning discharges upon the electrical condition of the earth I observed that sensitive receiving instruments arranged so as to be capable of responding to electrical disturbances created by the discharges at times failed to respond when they should have done so, and upon inquiring into the causes of this unexpected behavior I discovered it to be due to the character of the electrical waves which were produced in the earth by the lightning discharges and which had nodal regions following at definite distances the shifting source of the disturbances.”
Where does this page's data come from?
- Tomsk State University SOS70 observatory — Schumann spectrogram
- HeartMath Global Coherence Initiative — magnetometer network
- Australian Bureau of Meteorology, Space Weather Services — ionosphere
- NOAA SWPC — space weather: Kp index, X-ray flux, protons, solar wind
- Nikola Tesla — US Patent 787,412, Art of Transmitting Electrical Energy through the Natural Mediums (1905, public domain), Google Patents
- Nikola Tesla — Colorado Springs Notes, 1899–1900 (our primary-source page)
Every live panel on this page is observed measurement or published model output from these sources, reproduced as published.
The Whole Planet. $3.69 a Month.
One price. Every monitor, every feed, every tool. Founding member pricing — locked in for as long as you stay.
Get Full Access — $3.69/mo$3.69/mo locked for life — normal price $9.63/mo · Less than a cup of coffee · Cancel anytime
What do people ask about the Schumann Monitor?
What exactly is the Schumann resonance?
The Schumann resonance is a set of electromagnetic peaks in the extremely low frequency band of Earth's field. Lightning excites the cavity between the conductive ground and the lower ionosphere, and its fundamental standing wave sits near 7.83 Hz. This monitor shows it as the Tomsk observatory records it.
What are the Schumann resonance harmonics?
Above the 7.83 Hz fundamental, the cavity between Earth and the ionosphere rings at higher modes. This page reads four of them hour by hour from the Tomsk chart: SR1 7.83 Hz, SR2 14.3 Hz, SR3 20.8 Hz and SR4 27.3 Hz. They shift slightly through the day.
Where does the Schumann data come from?
The primary feed is the Tomsk SOS70 observatory in Siberia, mirrored here and refreshed every five minutes. Beside it sit global stations, ionospheric data and geomagnetic indices from NOAA and the Australian Bureau of Meteorology. Every panel is observed measurement or published model output; nothing here computes correlation.
Latest readings
Snapshot taken . The live panels on this page refresh in the browser.
- Tomsk Schumann spectrogram
- Live image, refreshed about every 5 minutes
- Cumiana live spectrogram
- Live image, refreshed about every 5 minutes