
E002 · MOON AND SUN VS GLOBAL M7+ EARTHQUAKE TIMESa Moon phase and tidal pull earthquake test · a published null result
Do large earthquakes happen more often at new or full Moon, at perigee, near the lunar nodes, or at high Moon+Sun tidal amplitude, compared with random times?
- NULL
- Result
- 704
- Earthquakes tested
- 1.44
- Largest |z|
- 1
- Smallest corrected p
- 12
- Tests (Bonferroni family)
- 12
- Cells shown
- 2
- Files fingerprinted
What was compared?
The earthquakes come straight from the agency that publishes them; the sky positions are computed and checked against the agency reference. Nothing is pre-filtered, nothing is hand-picked; every input is cached and fingerprinted (see 06).
| Role | Series | Primary source | Range · catalogs |
|---|---|---|---|
| Factor | Moon & Sun positions · Meeus ch. 47 + JPL elements, checked against JPL Horizons DE441 | https://ssd.jpl.nasa.gov/horizons/ | 1970 → 2025 |
| Target | USGS ComCat | https://earthquake.usgs.gov/fdsnws/event/1/ | A: M7.0+ mainshocks 1970–2025 (n = 704), declustered from M5.5+ |
How was the test run?
For each of 704 M7.0+ mainshocks (USGS ComCat, real UTC event times, Gardner–Knopoff 1974 declustering of the M5.5+ catalog) the Moon phase, distance, ecliptic latitude, Earth–Sun distance and the Moon+Sun tidal amplitude (M/d³) are computed and summarised by 12 metrics. Each is compared with a Monte Carlo null of 2000 randomized-time sets under three schemes — A uniform over 1970–2025, B same day-of-year in a random year, C same year at a random time — seed 369. A metric keeps the least extreme null; its p (normal approximation from z) is Bonferroni-corrected over 12. EFFECT needs corrected p < 0.05.
Every cell, nothing left out
z says how far the value at earthquake times sits from the random-time values, in random-time standard deviations; values under 2 are ordinary scatter. Corrected p is two-sided and already multiplied by the 12 tests; EFFECT needs it below 0.05.
| Metric | n | Observed (quake times) | Random-time mean | z | corrected p | Result |
|---|---|---|---|---|---|---|
| New-or-full Moon bunching (Rayleigh, doubled phase) | 704 | 0.0301 | 0.03392 | -0.22 | 1 | NULL |
| Moon phase bunching (Rayleigh) | 704 | 0.0587 | 0.03379 | +1.38 | 1 | NULL |
| Share within 30° of new/full Moon | 704 | 0.3196 | 0.3283 | -0.49 | 1 | NULL |
| Share within 30° of quarter Moon | 704 | 0.3438 | 0.3396 | +0.24 | 1 | NULL |
| Mean Moon distance (km) | 704 | 3.847e+05 | 3.849e+05 | -0.41 | 1 | NULL |
| Share with Moon closer than 370,000 km | 704 | 0.2244 | 0.2204 | +0.26 | 1 | NULL |
| Mean |Moon ecliptic latitude| | 704 | 3.2088 | 3.2768 | -1.13 | 1 | NULL |
| Share with Moon within 1° of a node | 704 | 0.1136 | 0.1233 | -0.76 | 1 | NULL |
| Mean Moon+Sun tidal amplitude (M/d³) | 704 | 1.064e+06 | 1.062e+06 | +0.39 | 1 | NULL |
| Mean tidal amplitude, alignment-weighted | 704 | 6.727e+05 | 6.747e+05 | -0.16 | 1 | NULL |
| Share at a supermoon (new/full ±20°, < 370,000 km) | 704 | 0.05398 | 0.06801 | -1.44 | 1 | NULL |
| Mean Earth–Sun distance (au) | 704 | 1 | 1.0001 | -0.38 | 1 | NULL |
Every test, drawn
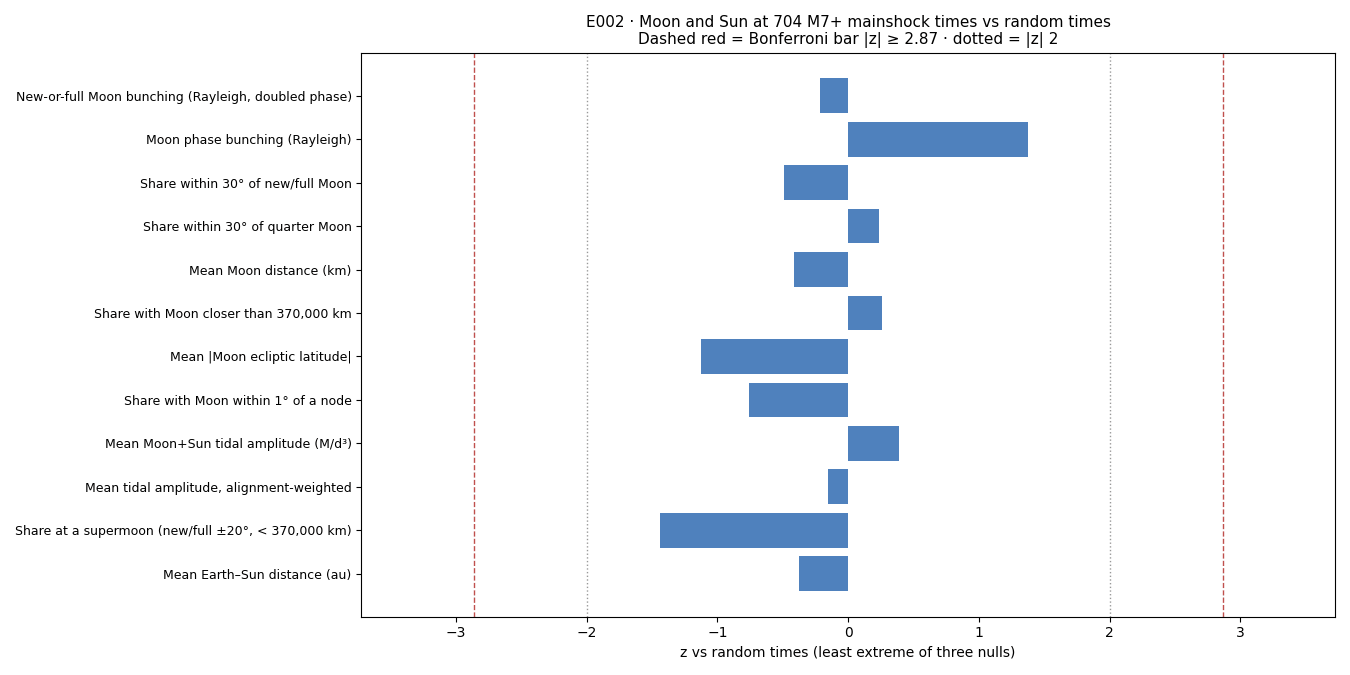
Amplitude only: the tide is not resolved onto each fault plane (Ide et al. 2016 did that and report a few-percent rate change for the largest events). E003 extends this to M5.5+ by magnitude and depth group. Earlier research run 2026-09-04 used date-only times on the undeclustered M7+ list.
Who asked this before us?
An evaluation is not a discovery. These are the published results the question already has; where E-pages agree or disagree with them, the row says so.
- Ide, S., Yabe, S. & Tanaka, Y. (2016). Earthquake potential revealed by tidal influence on earthquake size–frequency statistics. Nature Geoscience 9, 834–837. doi:10.1038/ngeo2796 — Resolves the tide onto each fault and reports a modest rise in the share of large events at high tidal stress. This evaluation tests tidal amplitude only and sees no measurable effect; it does not test their fault-resolved measure, so it neither confirms nor contradicts it.
- Gardner, J. K. & Knopoff, L. (1974). Is the sequence of earthquakes in Southern California, with aftershocks removed, Poissonian? Bull. Seismol. Soc. Am. 64, 1363–1367. — Declustering windows used here.
Reproduce every number above
The script reads the cached USGS catalog and JPL Horizons reference shipped in the zip, declusters, draws the nulls and writes E002_result.json. Change --draws or --seed and see whether anything moves.
python3 tq_eval_002_moon_sun.py --seed 369 --draws 2000
| Item | Value |
|---|---|
| Script | tq_eval_002_moon_sun.py |
| Script SHA-256 | 11bdff4ff96c9e84fccc1f6392d1435cc15b124feaab84f2f6c29c168f63d45d |
| Run on | NIK · 2026-10-27 · seed 369 |
| Source copy | E002_reproduce.zip — the script, its helper, both cached inputs, in one download. |
SHA-256 of every cached input
USGS ComCat M5.5+ 1970–2025 downloaded 2026-09-04 and cached unchanged; JPL Horizons reference positions cached on the first run. Re-runs read the cache, so the numbers do not drift when the agencies revise their catalogs.
| File | SHA-256 |
|---|---|
| usgs_m55_1970_2025.csv | eb0b76b9c7b7bcf9cad71b8a18652509df1247428ab2f7ca1a07d1b9a81ad16c |
| horizons_check.json | ea6f19dd78da89955ef1b94ebfeb74475e3f2014bd6a5f7fb352261c8b7a379d |
Hashed and time-stamped
Every file behind this page — the result, the verdict, the chart, the script, its helpers and every cached input — is listed with its SHA-256 in the manifest. The manifest itself was submitted to OpenTimestamps on 2026-10-27; the proof is anchored in the Bitcoin blockchain, so anyone can show these numbers existed, unchanged, on that date.
| Item | Value |
|---|---|
| Manifest | E002_MANIFEST.sha256 · 9 files |
| Manifest SHA-256 | c7423ad95ef0fd94c29bf43c72d6a2773f8c7e3eec16c975f9c34f01289194b7 |
| Time-stamp | E002_MANIFEST.sha256.ots · OpenTimestamps · 2026-10-27 |
| Verify | sha256sum -c E002_MANIFEST.sha256 then ots verify E002_MANIFEST.sha256.ots |
What do people ask about E002?
What did E002 test?
Do large earthquakes happen more often at new or full Moon, at perigee, near the lunar nodes, or at high Moon+Sun tidal amplitude, compared with random times?
What was the result?
NULL. Across 12 cells (12 tests) the most extreme value sat 1.44 standard deviations from the random-time values; after correcting for the number of tests the smallest p was 1, so nothing passes.
Where does the data come from?
USGS ComCat for the earthquakes; Moon and Sun positions computed with Meeus and JPL elements and checked against JPL Horizons on 40 dates. Every input is cached and fingerprinted with SHA-256.