
E001 · PLANET POSITIONS VS GLOBAL M7+ EARTHQUAKE TIMESa planet-position earthquake test · a published null result
Do the eight planets sit anywhere unusual — ecliptic latitude, nodes, proximity to Earth, angle to the Sun — at the times of large earthquakes, compared with random times?
- NULL
- Result
- 704
- Earthquakes tested
- 2.62
- Largest |z|
- 0.543
- Smallest corrected p
- 62
- Tests (Bonferroni family)
- 8
- Cells shown
- 2
- Files fingerprinted
What was compared?
The earthquakes come straight from the agency that publishes them; the sky positions are computed and checked against the agency reference. Nothing is pre-filtered, nothing is hand-picked; every input is cached and fingerprinted (see 06).
| Role | Series | Primary source | Range · catalogs |
|---|---|---|---|
| Factor | Planet positions · JPL Table 2a/2b elements, checked against JPL Horizons DE441 | https://ssd.jpl.nasa.gov/horizons/ | 1970 → 2025 |
| Target | USGS ComCat | https://earthquake.usgs.gov/fdsnws/event/1/ | A: M7.0+ mainshocks 1970–2025 (n = 704), declustered from M5.5+ |
How was the test run?
For each of 704 M7.0+ mainshocks (USGS ComCat, real UTC event times, Gardner–Knopoff 1974 declustering of the M5.5+ catalog) the positions of Mercury → Pluto are computed and summarised by 8 metrics per planet (62 tests; Sun-angle for Mercury/Venus left out because they never reach opposition). Each metric is compared with a Monte Carlo null of 2000 randomized-time sets under three schemes — A uniform over 1970–2025, B same day-of-year in a random year, C same year at a random time (C removes the slow-planet artefact) — seed 369. A cell keeps the least extreme of the three nulls; its p (normal approximation from z) is Bonferroni-corrected over all 62 tests. EFFECT needs corrected p < 0.05.
Every cell, nothing left out
z says how far the value at earthquake times sits from the random-time values, in random-time standard deviations; values under 2 are ordinary scatter. Corrected p is two-sided and already multiplied by the 62 tests; EFFECT needs it below 0.05.
| Planet | Most extreme metric | n | Observed (quake times) | Random-time mean | z | corrected p | Result |
|---|---|---|---|---|---|---|---|
| Mercury | mean proximity index | 704 | 48.1922 | 46.3798 | +1.67 | 1 | NULL |
| Venus | share at proximity ≥ 80 | 704 | 0.1562 | 0.1828 | -1.84 | 1 | NULL |
| Mars | share near max latitude | 704 | 0.3665 | 0.3542 | +0.67 | 1 | NULL |
| Jupiter | share near node AND close | 704 | 0.03409 | 0.04414 | -1.28 | 1 | NULL |
| Saturn | share within 30° of conjunction/opposition | 704 | 0.3807 | 0.3336 | +2.62 | 0.543 | NULL |
| Uranus | share near max latitude | 704 | 0.3693 | 0.3732 | -1.49 | 1 | NULL |
| Neptune | mean |ecliptic latitude| | 704 | 0.8257 | 0.8262 | -0.85 | 1 | NULL |
| Pluto | mean |ecliptic latitude| | 704 | 9.9411 | 9.9484 | -1.44 | 1 | NULL |
Every test, drawn
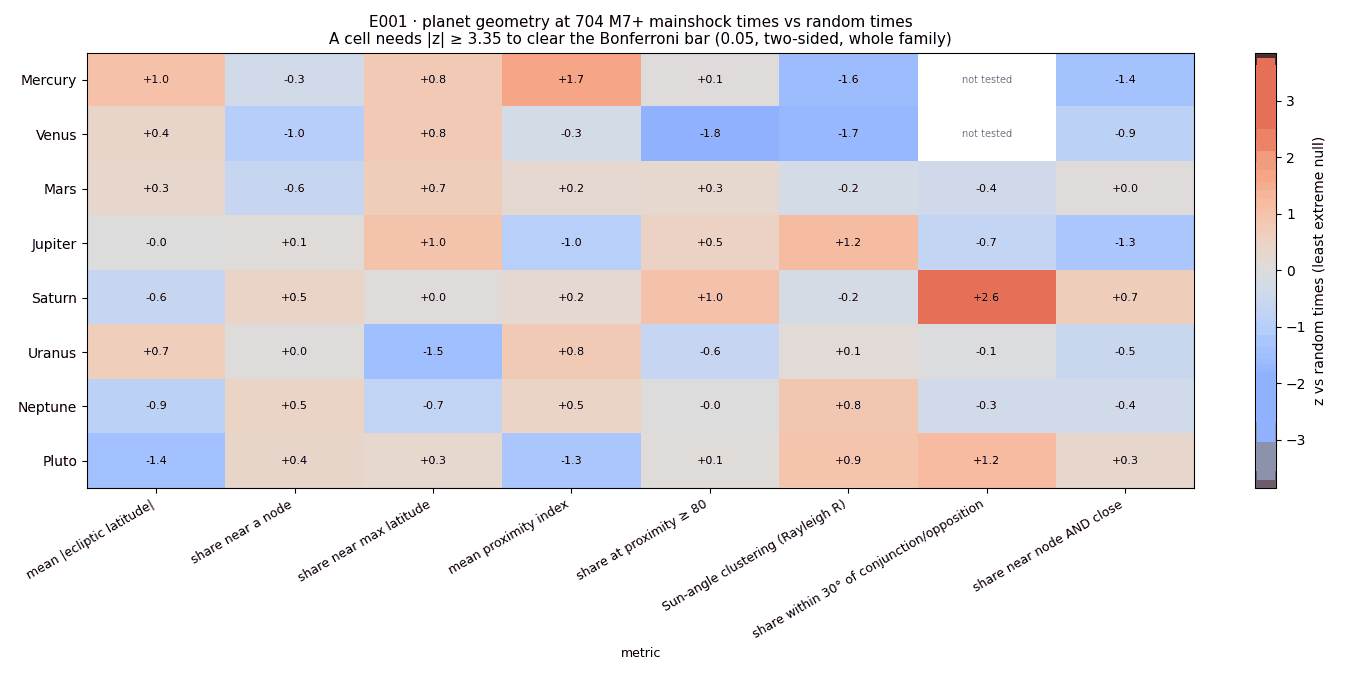
Quake times are hypocentre origin times; planet positions use the Almanac v1.3 core (J2000 ecliptic). Proximity is the Almanac 1–100 index per planet. Earlier research run 2026-09-04 used date-only times on the undeclustered M7+ list; this is the stricter re-run.
Reproduce every number above
The script reads the cached USGS catalog and JPL Horizons reference shipped in the zip, declusters, draws the nulls and writes E001_result.json. Change --draws or --seed and see whether anything moves.
python3 tq_eval_001_planets.py --seed 369 --draws 2000
| Item | Value |
|---|---|
| Script | tq_eval_001_planets.py |
| Script SHA-256 | 84e3a2c9844ac9b8cd901bf562e49875a934d72ca7a141dd02899c2da6a607e8 |
| Run on | NIK · 2026-10-27 · seed 369 |
| Source copy | E001_reproduce.zip — the script, its helper, both cached inputs, in one download. |
SHA-256 of every cached input
USGS ComCat M5.5+ 1970–2025 downloaded 2026-09-04 and cached unchanged; JPL Horizons reference positions cached on the first run. Re-runs read the cache, so the numbers do not drift when the agencies revise their catalogs.
| File | SHA-256 |
|---|---|
| usgs_m55_1970_2025.csv | eb0b76b9c7b7bcf9cad71b8a18652509df1247428ab2f7ca1a07d1b9a81ad16c |
| horizons_check.json | 507fb16447190f1ef29f8eb6bf8cb92a6c7b5705d7304c4ee73acedb7707dad4 |
Hashed and time-stamped
Every file behind this page — the result, the verdict, the chart, the script, its helpers and every cached input — is listed with its SHA-256 in the manifest. The manifest itself was submitted to OpenTimestamps on 2026-10-27; the proof is anchored in the Bitcoin blockchain, so anyone can show these numbers existed, unchanged, on that date.
| Item | Value |
|---|---|
| Manifest | E001_MANIFEST.sha256 · 9 files |
| Manifest SHA-256 | e3a9db2cc4a8868228501593d8502edd3f5385ce83ce007c7cb8f0a2177b20e6 |
| Time-stamp | E001_MANIFEST.sha256.ots · OpenTimestamps · 2026-10-27 |
| Verify | sha256sum -c E001_MANIFEST.sha256 then ots verify E001_MANIFEST.sha256.ots |
What do people ask about E001?
What did E001 test?
Do the eight planets sit anywhere unusual — ecliptic latitude, nodes, proximity to Earth, angle to the Sun — at the times of large earthquakes, compared with random times?
What was the result?
NULL. Across 8 cells (62 tests) the most extreme value sat 2.62 standard deviations from the random-time values; after correcting for the number of tests the smallest p was 0.543, so nothing passes.
Where does the data come from?
USGS ComCat for the earthquakes; planet positions computed from JPL orbital elements and checked against JPL Horizons on 40 dates. Every input is cached and fingerprinted with SHA-256.